Usage#
%load_ext autoreload
%autoreload 2
import pertpy
from deres import DEResult
import scanpy as sc
import numpy as np
import pandas as pd
Build example dataset#
For the sake of this example, we just go with the pbmc3k dataset and assign a random sample identifier to
each cell to mimick a multi-sample dataset.
adata = sc.datasets.pbmc3k_processed()
adata.obs["sample"] = pd.Categorical([f"sample_{x}" for x in np.random.randint(0, 10, adata.shape[0])])
# raw.X contains log-normalized values which we are going to use here
adata = sc.AnnData(adata.raw.X, obs=adata.obs, var=adata.raw.var)
Run differential expression testing#
We first contruct a pseudobulk-object and then use the statsmodels implementation in pertpy to compare gene expression between cell-types. For the sake of the example, we compare CD8+ T cells with CD4+ T cells and NK cells.
pb = sc.get.aggregate(adata, ["sample", "louvain"], "mean")
mod = pertpy.tl.Statsmodels(pb, design="~ louvain", layer="mean")
mod.fit()
res = mod.test_contrasts(
    {
        "CD8_vs_CD4": mod.cond(louvain="CD8 T cells") - mod.cond(louvain="CD4 T cells"),
        "CD8_vs_NK": mod.cond(louvain="CD8 T cells") - mod.cond(louvain="NK cells"),
    }
)
res["p_value"] = res["p_value"].astype(float)  # don't ask me why this is an object column
res
| variable | p_value | t_value | sd | log_fc | adj_p_value | contrast | |
|---|---|---|---|---|---|---|---|
| 3694 | GZMK | 2.703991e-38 | 2.689104e+01 | 0.026700 | 7.179881e-01 | 2.703991e-38 | CD8_vs_CD4 |
| 11083 | CCL5 | 2.549464e-33 | 2.235275e+01 | 0.080934 | 1.809106e+00 | 2.549464e-33 | CD8_vs_CD4 |
| 9292 | GZMH | 5.377138e-31 | 2.044751e+01 | 0.029001 | 5.930062e-01 | 5.377138e-31 | CD8_vs_CD4 |
| 13001 | NKG7 | 2.996402e-30 | 1.986191e+01 | 0.088122 | 1.750264e+00 | 2.996402e-30 | CD8_vs_CD4 |
| 3695 | GZMA | 2.014626e-26 | 1.703723e+01 | 0.048890 | 8.329481e-01 | 2.014626e-26 | CD8_vs_CD4 |
| ... | ... | ... | ... | ... | ... | ... | ... |
| 3098 | PIGZ | 1.000000e+00 | -9.221825e-17 | 0.004703 | -4.336809e-19 | 1.000000e+00 | CD8_vs_NK |
| 2663 | HESX1 | 1.000000e+00 | 9.988825e-17 | 0.004342 | 4.336809e-19 | 1.000000e+00 | CD8_vs_NK |
| 7952 | CCND1 | 1.000000e+00 | 0.000000e+00 | 0.004221 | 0.000000e+00 | 1.000000e+00 | CD8_vs_NK |
| 1505 | TP53I3 | 1.000000e+00 | 0.000000e+00 | 0.012417 | 0.000000e+00 | 1.000000e+00 | CD8_vs_NK |
| 9584 | RP11-164H13.1 | 1.000000e+00 | -6.781390e-17 | 0.012790 | -8.673617e-19 | 1.000000e+00 | CD8_vs_NK |
27428 rows × 7 columns
Construct DEResult class#
DEResult is class that holds a dataframe with DE results and associated metadata (e.g. which columns to use). The DEResult instance then provides summary and plotting functions to investigate the differential expression results.
de_res = DEResult(
    res, pb, p_col="p_value", effect_size_col="log_fc", var_col="variable", contrast_col="contrast", layer="mean"
)
de_res.summary()
| total | up | down | contrast | |
|---|---|---|---|---|
| p < 0.1 | 1004 | 388 | 616 | CD8_vs_CD4 |
| p < 0.05 | 720 | 254 | 466 | CD8_vs_CD4 |
| p < 0.01 | 435 | 126 | 309 | CD8_vs_CD4 |
| p < 0.001 | 275 | 72 | 203 | CD8_vs_CD4 |
| p < 0.0001 | 153 | 45 | 108 | CD8_vs_CD4 |
| p < 0.1 | 1833 | 894 | 939 | CD8_vs_NK |
| p < 0.05 | 1168 | 581 | 587 | CD8_vs_NK |
| p < 0.01 | 632 | 317 | 315 | CD8_vs_NK |
| p < 0.001 | 321 | 163 | 158 | CD8_vs_NK |
| p < 0.0001 | 186 | 82 | 104 | CD8_vs_NK |
We can use .p_adjust to apply FDR correction of the p-values. It adds another column with the adjusted p-values
to the results data frame and updates the pointer of the p-value column to use to use the FDR-adjusted p-values.
As a result, we can see in the summary DF, that now a lot fewer genes are considered significant at the different thresholds.
de_res.p_adjust()
de_res.summary()
| total | up | down | contrast | |
|---|---|---|---|---|
| p < 0.1 | 323 | 85 | 238 | CD8_vs_CD4 |
| p < 0.05 | 280 | 72 | 208 | CD8_vs_CD4 |
| p < 0.01 | 158 | 48 | 110 | CD8_vs_CD4 |
| p < 0.001 | 94 | 35 | 59 | CD8_vs_CD4 |
| p < 0.0001 | 68 | 29 | 39 | CD8_vs_CD4 |
| p < 0.1 | 421 | 207 | 214 | CD8_vs_NK |
| p < 0.05 | 331 | 166 | 165 | CD8_vs_NK |
| p < 0.01 | 196 | 87 | 109 | CD8_vs_NK |
| p < 0.001 | 124 | 51 | 73 | CD8_vs_NK |
| p < 0.0001 | 85 | 29 | 56 | CD8_vs_NK |
Use plotting functions#
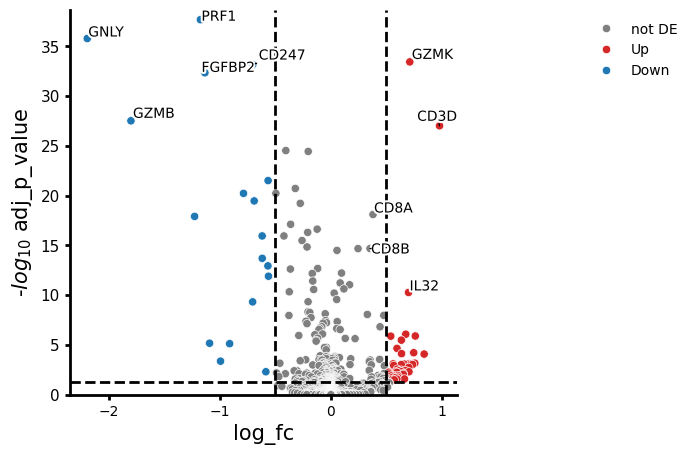
de_res.plot_volcano("CD8_vs_NK", log2fc_thresh=0.5)
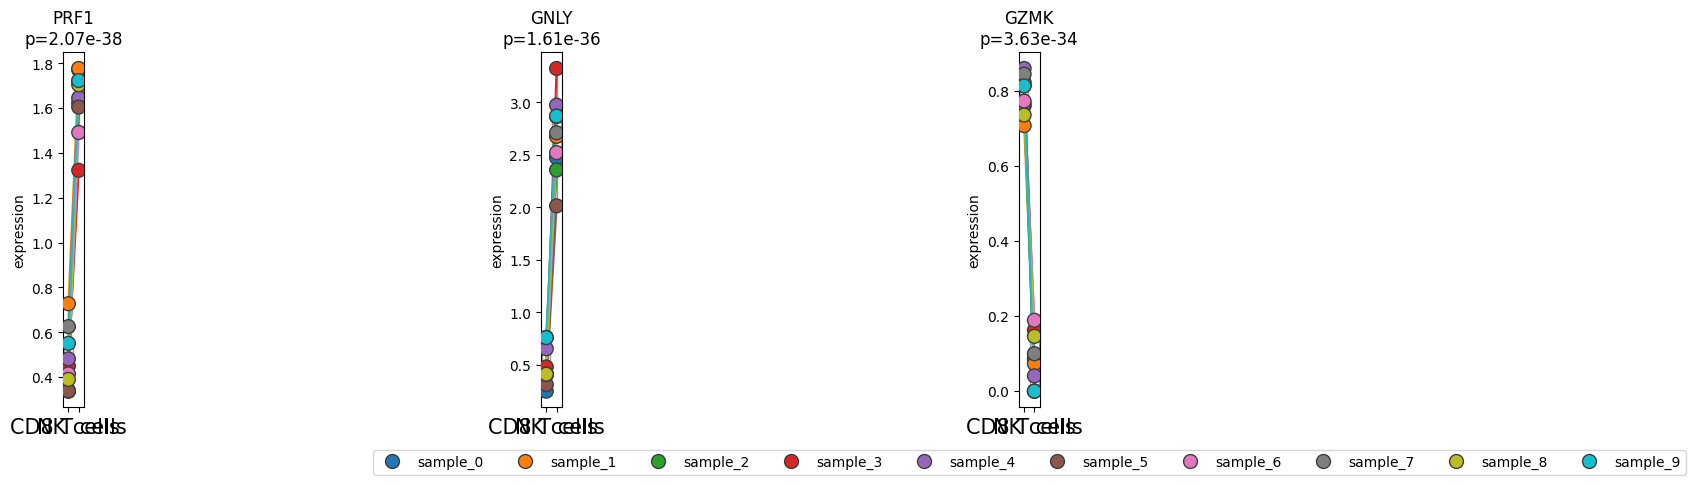
de_res.plot_paired("louvain", "sample", "CD8_vs_NK", groups=["CD8 T cells", "NK cells"], n_top_vars=3)
Index(['CD8 T cells', 'NK cells'], dtype='object')
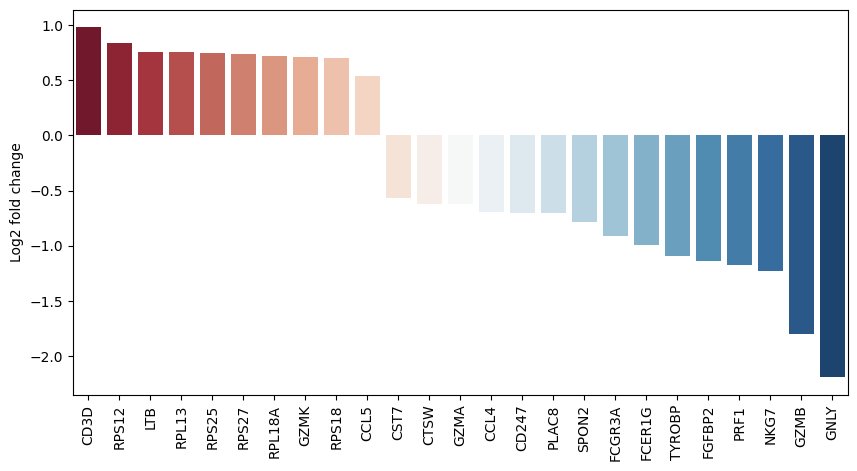
de_res.plot_fold_change("CD8_vs_NK")
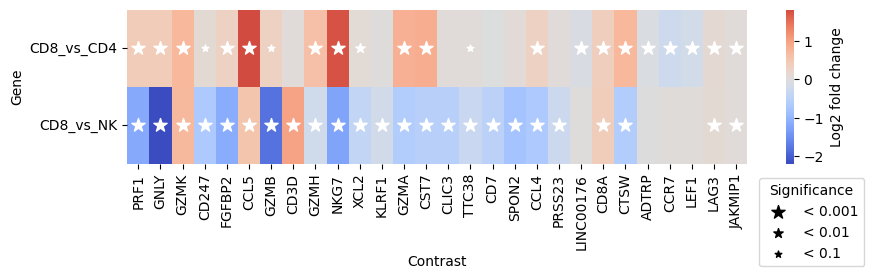
de_res.plot_multicomparison_fc()